The impact of COVID-19 on New York City Bike
Mobility on Demand Systems: Data-Driven Analysis, Simulation, Visualization
ARCH 6306/6050, DSBA 6010, ITIS 8010/6010: Wednesdays 6pm-8:30pm, Taught Online
Team: Ivan Flores Martinez, Bianca Moore, Jake D'Antoni, Samrhiti Kamat
Advisor: Dr. Dimitris Papanikolaou | dpapanik@uncc.edu | Urban Synergetics Lab | https://urbansynergeticslab.net

Research Question
How has COVID-19 altered shared bike patterns and demand in NYC?
Background
The COVID-19 pandemic has altered NYC’s shared bike system to include less trips for commuting purposes and more trips for leisure. This general conclusion is supported by changes in Citi Bike data from the years 2019 and 2020 that show less subscribers & more non-subscribers in 2020, shorter trips in 2020, an increase in round trips in 2020, and a change in popular station locations from commercial districts to alternative locations.
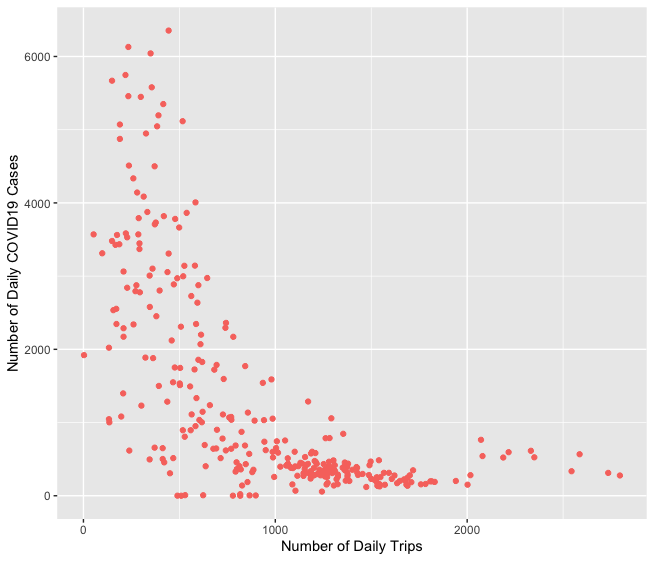
Covid cases vs number of trips in NYC in 2020
Covid cases in New York City in 2020
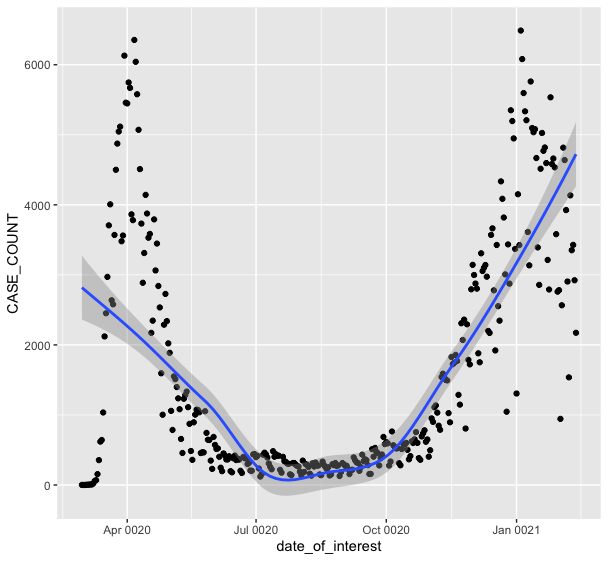
COVID-19 shutdowns began in March of 2020 in the state of New York. The number of COVID-19 cases in NYC today amount to over 676,000 with over 28,000 deaths. We collected data from New York Public Health repository for the graphs above. Analyzing the months in which COVID-19 cases and number of bike trips correlated determined which months were the most significant for our study.
Number of trips in NYC in 2020 and 2019
As compared to 2019 the number of trips in NYC drastically decreased in the month of March 2020 due to the lockdown the city faced. However, the overall trend between the years was not affected significantly. As the city went in phase 1 and 2 of the virus outbreak the usage of the Bike Sharing system seemed to have increased again. The number of trips in the month of october 2019 and 2020 seemed to be similar which concludes that the city went back to routine and utility in the later months of the year 2020.
There were less suscribers and more casual users in 2020 due to Covid-19
The graphs above, compare the number of rides based on customer type in 2019 and 2020 from the months between January and June. In both the years there is a clear trend of subscribers being higher than the non-subscribers, the subscription rate decreased from 2019 and 2020.In 2019, the graph describes an incline in the number of subscriber rides but in 2020, a dip in the usage is observed in the months of March and April. It can be assumed that this decline can be caused due to the lockdown the city went through in 2020 due to COVID-19. However, the number of rides seemed to pick up again post lockdown. Another distinct change in trend observed from 2019 to 2020 is the number of non-subscribers seemed to increase in 2020. Though these observations, we can see that subscriptions began to decline during the COVID-19 outbreak and non-subscribers increased in 2020.
There were shorter trips in 2020 due to Covid-19
"Trip duration in 2019 vs 2020"
The graph compares the trip durations grouped by minutes of the CitiBike in NYC in the years 2019 and 2020. It can be noted that not only did the number of trips decline but also did the duration of trips. Shorter trips were observed in 2020 as compared to 2019
There were more round trips in 2020 due to Covid-19
Top 60 stations in 2019
Top 60 stations in 2020
The chord diagram represents connections between the top 60 stations in 2019 and 2020. While the top stations between years are not consistent with each other, their overlap displays the interconnections between stations. Compared to 2019, interconnectivity decreased between stations. One explanation of this behavior is that the number of commuters decreased in 2020 while the number of recreational bike users increased. In addition, bike users also made shorter trips in 2020.
There were less popular stations in comercial districts in 2020 due to Covid-19
Top Stations 2019
Top Stations 2020
The maps above represent the top ten stations identified by how frequently they were used as end stations and the height specifies the exact number of trips made in the year 2019 and 2020. The density of end stations is shown by the array of circles with density ranging from more trips (yellow) to less trips (purple). On comparing the two maps above, it can be observed that from the year 2019 to 2020, not only did the highest number of trips drop by 33% but also the densities of stations most frequently used changed. While the top stations with most densities were observed to be more clustered in the center of Manhattan, Midtown in 2019, the top stations in 2020 were observed to be more scattered and towards the waterfront edges between New York and New Jersey, popular parks and recreational squares.
Land use
The map above compares the Bike Sharing stations in the year 2019 and 2020, with a layer of land use pattern of NYC showing the manufacturing & commercial districts in comparison with residential areas. While the red and yellow circles represent the top ten stations used in the year 2019 and 2020 respectively, the black circles represent the stations which remained to be popular throughout the two years. New popular stations arose in areas which were less commercial, correlating to a decrease in commuter trips.
Conclusion
The data points to the conclusion that more recreational trips were taken in 2020 due to the COVID-19 pandemic.
References
- Hu, Winnie. “A Surge in Biking to Avoid Crowded Trains in N.Y.C.” The New York Times. The New York Times, March 14, 2020. https://www.nytimes.com/2020/03/14/nyregion/coronavirus-nyc-bike-commute.html
- Calgary, Open. “Bicycle Routes.” NYC Open Data. Accessed February 17, 2021. https://data.cityofnewyork.us/Transportation/Bicycle-Routes/7vsa-caz7.
- Tedeschi, Alexander. “Rebalancing Citi Bike : a Geospatial Analysis of Bike Share Redistribution in New York City.” RUN, February 26, 2016. https://run.unl.pt/handle/10362/17842?locale=en.
- Teixeira, João Filipe, and Miguel Lopes. “The Link between Bike Sharing and Subway Use during the COVID-19 Pandemic: The Case-Study of New York's Citi Bike.” Transportation Research Interdisciplinary Perspectives. Elsevier, July 8, 2020. https://www.sciencedirect.com/science/article/pii/S2590198220300774.
- Apple mobility trends 2020-2021.
Team & Contributions
Ivan Flores Martinez
Ivan Flores took the lead with regards to setting up the github website, cleaning data, and creating chord graphs, scatterplots, and stacked bar graphs in D3 for the webpage. He also aided in putting together the github website.
Bianca Moore
Bianca Moore contributed graphs for analyses, exports for assisting with map discovery. She aided putting together the github website.
Jake D'Antoni
Jake D'Antoni produced the bike sharing maps via Kepler and Mapbox and cleaned the data for the assignment. He also aided in putting together the github website.
Samrhiti Kamat
Samrhiti Kamat produced the content to the graphs and maps in the website. She aided putting together the github website.